The "Lower 60"
Jump ahead to the hypothetical new states.
Jump ahead to the revised state demographic table.
The "Lower 60" is a geography/GIS idea I recently worked
on. It was prompted by a message posted on a forum I often read that
considered "hypothetical new states". After mulling over the idea, I set
about creating a "what-if" scenario, postulating what the existing "Lower 48"
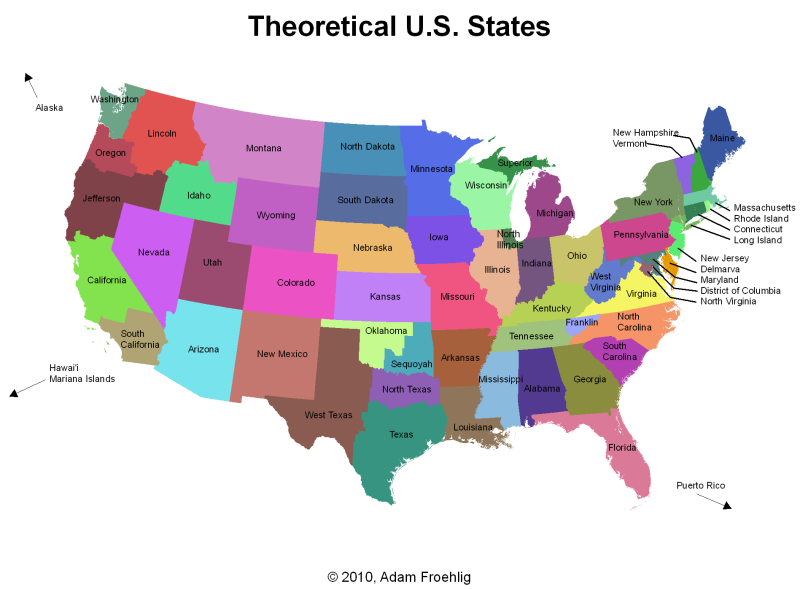
might look like today had some of the proposals for new U.S. states been successful. The result
is captured in the following map:
A larger version
and a PDF version are also available.
The hypothetical "new" states:
- Delmarva - Capitol: Dover. Largest
City: Wilmington. This combination of a new state and existing
state is based on a few proposals over the years, mostly by Maryland Eastern
Shore legislators, for the Maryland Eastern Shore counties to secede from
the rest of Maryland and join with the two Virginia Eastern Shore counties
and Delaware into a single state. While such a state could still
easily be called Delaware, I've chosen to name it Delmarva (as with some of
the legislative proposals) due to the new/revised state covering the
entirety of the Delmarva Peninsula.
- District of Columbia - This one may or may not
become a state in the future, but I have included here as the "60th lower
state" for completeness..."Lower 59" just didn't sound right.
- Franklin - Capitol: Greeneville.
Largest City: Knoxville. This was one of the "almost happened"
states. In the mid-1780s, the northeastern corner of today's Tennessee
(which at the time belong to North Carolina) requested statehood from the
Continental Congress, but failed in its statehood bid. It managed to
survive for about 6 years before being absorbed back into North Carolina,
then later becoming part of Tennessee. I have resurrected it here with
some changes. The original state, in modern-day county terms,
comprised of 11 counties, from Blount to Hawkins and east. I have
included Knoxville in this state as well as the counties along and east of
I-75 to the north, for a total of 20 counties. I also think the Little
Tennessee, Tennessee, Clinch, Emory, and Little Emory Rivers make a more
natural southwestern boundary, and so have adjusted county boundaries
accordingly, with the small bit of Monroe County north of the Little
Tennessee being absorbed by Blount and Loudon Counties. Loudon County
north of the Little Tennessee and Tennessee Rivers becomes a new "Lenoir
County" in the state of Franklin, with the segment of Roane County between
the Tennessee and Clinch Rivers being added to Lenoir County. Roane
County to the north of the Clinch and Emory Rivers becomes part of Anderson
County, and the state line briefly follows Walden Ridge here.
- Jefferson - Capitol: Yreka.
Largest City: Redding. This state is a "could have been".
Due to what regional residents was felt as neglect (real or perceived) from
the Oregon and California state governments, a serious proposal for the area
to secede and become its own state happened in 1941. The movement got
as far as approving a name, a provisional state capitol, a flag, and a
provisional governor. What stalled and ultimately killed the idea was
the death of the movement's champion plus the attack on Pearl Harbor and the
nation's subsequent involvement in World War 2. I have included it
here, with the core 7 counties (3 in CA, 4 in OR) plus adjacent counties in
both states of similar mindsets, for a total of 21 counties.
- Lincoln - Capitol: Lewiston.
Largest City: Spokane. This is a state that has been proposed
off-and-on over the years, most recently in 2005. The core proposal
consisted of creating a new state out of the Idaho Panhandle and Eastern
Washington (east of the Cascades). As with Jefferson, the new state
was proposed due to the perceived disconnect between residents and their
respective state capitols, especially in Washington. I expanded upon
that to include several northeastern Oregon counties, some of which are part
of the "Inland
Empire" region that also includes the Idaho Panhandle and Eastern
Washington. As with the other regions, northeastern Oregon feels
slighted by their state capitol.
- Long Island - Capitol: Manhattan (New York).
Largest City: Brooklyn (New York). One person has suggested that
I should call this state "Gotham", and I did consider that as a name
briefly. There is a wide and well known disconnect between the New
York City metropolitan area and "Upstate New York". In addition, there
have been past considerations both for making NYC and Long Island their own
states, and at one point for even making NYC its own country. What
I've done here is created a new state combining Long Island, NYC, and the
downstate counties closest to NYC, mainly those that are bedroom communities
for the NYC region, as far north as Orange and Putnam Counties.
- Mariana Islands - Capitol: Hagatna.
Largest City: Saipan. This state, based on a news report out of
Australia in 2008, postulates Guam, Saipan, and the other Northern Mariana
Islands (all of which have similar culture and indigenous peoples) combining
into one and becoming a U.S. state.
- North Illinois - Capitol: Aurora.
Largest City: Chicago. Also could be named "Chicago", and was
partially considered for such back in 1925. Similar in concept to
"Long Island" above, this state is based on the notable differences between
the Chicago metropolitan area and the rest of Illinois. It takes the 8
core Illinois counties of the Chicago area plus Lake (renamed Gary) and
Porter Counties in Indiana, and combines them into a single state.
- North Texas - Capitol: Irving. Largest
City: Dallas. According to several websites, the legal basis
behind the Texas annexation to the U.S. allows the state to break up into as
many as five smaller states. What I have done here is split the state
into three while attempting to keep the three regions geographically and
socially homogenous. North Texas covers most of the counties north of
Waco and east of Abilene, centered on the Dallas-Fort Worth Metroplex.
- North Virginia - Capitol/Largest City:
Alexandria. This state is yet another case of major
political/economic/cultural differences between a major urban area within a
state and the more rural area of the rest of the state. Also
highlighted in the November, 2008 issue of the Washingtonian magazine, this
idea postulates Northern Virginia, part of the D.C. metropolitan area,
splitting off from the rest of Virginia, using the Rappahannock River and
the Blue Ridge as natural boundaries.
- Puerto Rico - Capitol/Largest City: San
Juan. This project assumes that Puerto Rico eventually becomes a U.S.
state.
- Sequoyah - Capitol: Muskogee.
Largest City: Tulsa. Another of the "almost happened" states.
In 1905, five Indian tribes from what is now eastern Oklahoma banded
together to try and incorporate what was then Indian Territory as a separate
state from Oklahoma. A Constitutional Convention was formed and the
idea went to Washington, where it was ultimately defeated. This "new
state" idea resurrects that early proposal, utilizing the modern-day county
equivalents.
- South California - Capitol: San
Bernardino. Largest City: Los Angeles. Over the years,
there have been numerous proposals to split California into smaller states,
including the proposal for the State of Jefferson listed above. This
idea for a South California is based on those proposals that suggest a split
into 3 states: Northern (covered by Jefferson above), Central, and
Southern. This South California includes the area from Ventura, Los
Angeles, and San Bernardino Counties south.
- Superior - Capitol/Largest City:
Marquette. The idea of splitting the Upper Peninsula of Michigan from
the rest of the state dates back as early as the mid-1800s. It is yet
another of the state secession proposals brought about due to
real-or-perceived slights against the area's population from the state
capitol. In this case, there are also cultural differences between the
two parts of Michigan. Some of the proposals have also included the
northernmost Wisconsin counties, but I have excluded them here.
- West Texas - Capitol: Midland. Largest
City: El Paso. As with North Texas, this is an attempt to create
a geographically homogenous region covering the mostly flat, dry, sparsely
populated western half of Texas.
Demographic Table
The following table was created to show how the new
states, the existing-but-revised states, and the rest of the states, compare to
each other in some basic demographic categories. In the following table,
the new states are highlighted in dark red while those existing states that had
borders changed are highlighted in dark orange. Unchanged states have a
black background. Data source is the U.S. Census Bureau.
| State |
2000 Population(1) |
2000 Rank |
2008 Population(2) |
2008 Rank |
Total Area(3) |
Area Rank |
2008 Density(4) |
Density Rank |
US House Reps(5) |
Suggested Postal Code |
| Alabama |
4,447,100 |
25 |
4,661,900 |
26 |
52,419.02 |
28 |
91.87 |
36 |
7 |
AL |
| Alaska |
626,932 |
59 |
686,293 |
58 |
663,267.26(6) |
1 |
1.20 |
64 |
1 |
AK |
| Arizona |
5,130,632 |
19 |
6,500,180 |
15 |
113,998.30 |
5 |
57.20 |
44 |
9 |
AZ |
| Arkansas |
2,673,400 |
37 |
2,855,390 |
36 |
53,178.62 |
27 |
54.84 |
45 |
4 |
AR |
| California |
13,731,176 |
3 |
14,947,652 |
3 |
79,305.07 |
15 |
198.43 |
22 |
22 |
CA |
| Colorado |
4,301,261 |
26 |
4,939,456 |
24 |
104,093.57 |
8 |
47.62 |
48 |
7 |
CO |
| Connecticut |
3,405,565 |
32 |
3,501,252 |
32 |
5,543.33(6) |
58 |
722.68 |
10 |
5 |
CT |
| Delmarva |
1,144,950 |
53 |
1,262,719 |
53 |
9,009.82(6) |
53 |
225.80 |
17 |
2 |
DE |
| District of Columbia |
572,059 |
61 |
591,833 |
61 |
68.34(6) |
64 |
9,638.97 |
1 |
1 |
DC |
| Florida |
15,982,378 |
2 |
18,328,340 |
2 |
65,754.59(6) |
20 |
339.87 |
13 |
27 |
FL |
| Franklin |
1,397,047 |
48 |
1,524,287 |
48 |
7,703.10 |
56 |
204.26 |
20 |
2 |
FR |
| Georgia |
8,186,453 |
11 |
9,685,744 |
9 |
59,424.77 |
24 |
167.27 |
24 |
14 |
GA |
| Hawai'i |
1,211,537 |
52 |
1,288,198 |
52 |
10,930.98(6) |
49 |
200.57 |
21 |
2 |
HI |
| Idaho |
1,015,087 |
55 |
1,209,847 |
54 |
62,233.47 |
22 |
19.60 |
56 |
2 |
ID |
| Illinois |
4,273,029 |
28 |
4,353,141 |
29 |
52,267.59 |
29 |
84.40 |
38 |
6 |
IL |
| Indiana |
5,449,123 |
17 |
5,720,811 |
18 |
35,269.77 |
42 |
163.68 |
25 |
8 |
IN |
| Iowa |
2,926,324 |
33 |
3,002,555 |
34 |
56,271.55 |
25 |
53.74 |
46 |
4 |
IA |
| Jefferson |
1,362,364 |
49 |
1,440,660 |
49 |
88,089.19 |
10 |
16.93 |
58 |
2 |
JE |
| Kansas |
2,688,418 |
36 |
2,802,134 |
37 |
82,276.84 |
14 |
34.25 |
505 |
4 |
KS |
| Kentucky |
4,041,769 |
29 |
4,269,245 |
30 |
40,409.02 |
36 |
107.46 |
33 |
6 |
KY |
| Lincoln |
1,727,251 |
45 |
1,898,467 |
43 |
84,868.61 |
13 |
22.66 |
54 |
3 |
LN |
| Long Island |
12,409,515 |
4 |
12,958,938 |
5 |
5,079.25(6) |
60 |
4,105.00 |
2 |
19 |
LI |
| Louisiana |
4,468,976 |
24 |
4,410,796 |
28 |
51,839.70(6) |
30 |
101.25 |
35 |
6 |
LA |
| Maine |
1,274,923 |
50 |
1,316,456 |
50 |
35,384.65(6) |
41 |
42.66 |
49 |
2 |
ME |
| Mariana Islands |
224,026 |
64 |
258,002 |
64 |
394.02 |
63 |
654.79 |
11 |
1 |
MR |
| Maryland |
4,986,534 |
21 |
5,295,565 |
21 |
7,991.57(6) |
55 |
779.02 |
9 |
8 |
MD |
| Massachusetts |
6,349,097 |
15 |
6,497,967 |
16 |
10,554.57(6) |
50 |
828.82 |
8 |
9 |
MA |
| Michigan |
9,620,828 |
8 |
9,695,103 |
8 |
60,575.71(6) |
23 |
240.07 |
16 |
14 |
MI |
| Minnesota |
4,919,479 |
22 |
5,220,393 |
22 |
86,938.87 |
11 |
65.57 |
41 |
8 |
MN |
| Mississippi |
2,844,658 |
34 |
2,938,618 |
35 |
48,430.19 |
32 |
62.65 |
42 |
4 |
MS |
| Missouri |
5,595,211 |
16 |
5,911,605 |
17 |
69,704.31 |
19 |
85.82 |
37 |
9 |
MO |
| Montana |
902,195 |
56 |
967,440 |
56 |
147,042.40 |
2 |
6.65 |
62 |
1 |
MT |
| Nebraska |
1,711,263 |
47 |
1,783,432 |
47 |
77,353.73 |
16 |
23.20 |
53 |
3 |
NE |
| Nevada |
1,998,257 |
40 |
2,600,167 |
39 |
110,560.71 |
6 |
23.68 |
52 |
4 |
NV |
| New Hampshire |
1,235,786 |
51 |
1,315,809 |
51 |
9,349.94 |
52 |
146.72 |
29 |
2 |
NH |
| New Jersey |
8,414,350 |
10 |
8,682,661 |
12 |
8,721.30(6) |
54 |
1,170.59 |
4 |
13 |
NJ |
| New Mexico |
1,819,046 |
42 |
1,984,356 |
42 |
121,589.48 |
4 |
16.35 |
59 |
3 |
NM |
| New York |
6,566,942 |
14 |
6,531,359 |
14 |
49,476.73(6) |
31 |
148.25 |
27 |
9 |
NY |
| North Carolina |
8,049,313 |
12 |
9,222,414 |
10 |
53,818.51 |
26 |
189.33 |
23 |
13 |
NC |
| North Dakota |
642,200 |
58 |
641,481 |
59 |
70,699.79 |
18 |
9.30 |
61 |
1 |
ND |
| North Illinois |
8,777,626 |
9 |
9,204,403 |
11 |
6,794.76(6) |
57 |
1,869.52 |
3 |
13 |
NI |
| North Texas |
6,676,200 |
13 |
7,908,265 |
13 |
38,682.83 |
37 |
210.08 |
18 |
12 |
NT |
| North Virginia |
1,962,782 |
41 |
2,293,997 |
41 |
2,269.56 |
61 |
1,026.63 |
6 |
3 |
NO |
| Ohio |
11,353,140 |
7 |
11,485,910 |
7 |
44,824.90 |
34 |
280.50 |
14 |
17 |
OH |
| Oklahoma |
1,717,934 |
46 |
1,820,264 |
45 |
38,219.36 |
39 |
48.06 |
47 |
3 |
OK |
| Oregon |
2,728,231 |
35 |
3,064,599 |
33 |
29,331.67 |
46 |
108.44 |
32 |
4 |
OR |
| Pennsylvania |
12,281,054 |
5 |
12,448,279 |
6 |
46,055.24 |
33 |
277.76 |
15 |
18 |
PA |
| Puerto Rico |
3,808,610 |
31 |
3,954,037 |
31 |
5,324.50(6) |
59 |
1,154.61 |
5 |
6 |
PR |
| Rhode Island |
1,048,319 |
54 |
1,050,788 |
55 |
1,545.05(6) |
62 |
1,005.61 |
7 |
2 |
RI |
| Sequoyah |
1,732,720 |
44 |
1,822,097 |
44 |
31,678.83 |
45 |
59.17 |
43 |
3 |
SQ |
| South California |
19,329,839 |
1 |
20,951,463 |
1 |
44,324.20 |
35 |
494.95 |
12 |
31 |
SO |
| South Carolina |
4,012,012 |
30 |
4,479,800 |
27 |
32,020.20 |
44 |
148.78 |
26 |
7 |
SC |
| South Dakota |
754,844 |
57 |
804,194 |
57 |
77,116.49 |
17 |
10.60 |
60 |
1 |
SD |
| Superior |
317,616 |
63 |
308,319 |
63 |
36,140.32(6) |
40 |
18.78 |
57 |
1 |
SU |
| Tennessee |
4,292,236 |
27 |
4,690,601 |
25 |
34,440.12 |
43 |
138.96 |
31 |
7 |
TN |
| Texas |
11,807,685 |
6 |
13,945,752 |
4 |
104,510.10 |
7 |
140.71 |
30 |
20 |
TX |
| Utah |
2,233,169 |
39 |
2,736,424 |
38 |
84,898.83 |
12 |
33.31 |
51 |
4 |
UT |
| Vermont |
608,827 |
60 |
621,270 |
60 |
9,614.26 |
51 |
67.17 |
40 |
1 |
VT |
| Virginia |
5,064,335 |
20 |
5,429,209 |
20 |
38,399.28 |
38 |
147.95 |
28 |
8 |
VA |
| Washington |
4,587,173 |
23 |
5,107,078 |
23 |
28,793.73(6) |
47 |
206.64 |
19 |
7 |
WA |
| West Texas |
2,367,935 |
38 |
2,472,957 |
40 |
125,387.90 |
3 |
19.78 |
55 |
4 |
WT |
| West Virginia |
1,808,344 |
43 |
1,814,468 |
46 |
24,229.76 |
48 |
75.36 |
39 |
3 |
WV |
| Wisconsin |
5,363,675 |
18 |
5,627,967 |
19 |
65,497.82(6) |
21 |
103.63 |
34 |
8 |
WI |
| Wyoming |
493,782 |
62 |
532,668 |
62 |
97,813.56 |
9 |
5.49 |
63 |
1 |
WY |
Table Footnotes:
(1) - Population from the 2000 Census
(2) - Population is 2008 Estimate from the U.S. Census Bureau
(3) - Total area is in square miles, and includes both land and water area.
(4) - Density is based on 2008 population estimate and is for land area only.
Water area was not calculated.
(5) - My estimate of how many U.S. Representatives in Congress each state would
have. Assumes the number of House seats increases to 451 (from the
existing 435) to accommodate the new states.
(6) - For these states, 10% or more of their total area is covered by water.

Page last modified
10 February, 2010
© 2010, Adam Froehlig